New Monitoring widget on the Dashboard
We've added a Monitoring widget to the Neon Dashboard, giving you an easy way to check CPU and RAM usage for your Neon projects. The display defaults to your primary branch but you can switch to view usage details for any branch in your project.
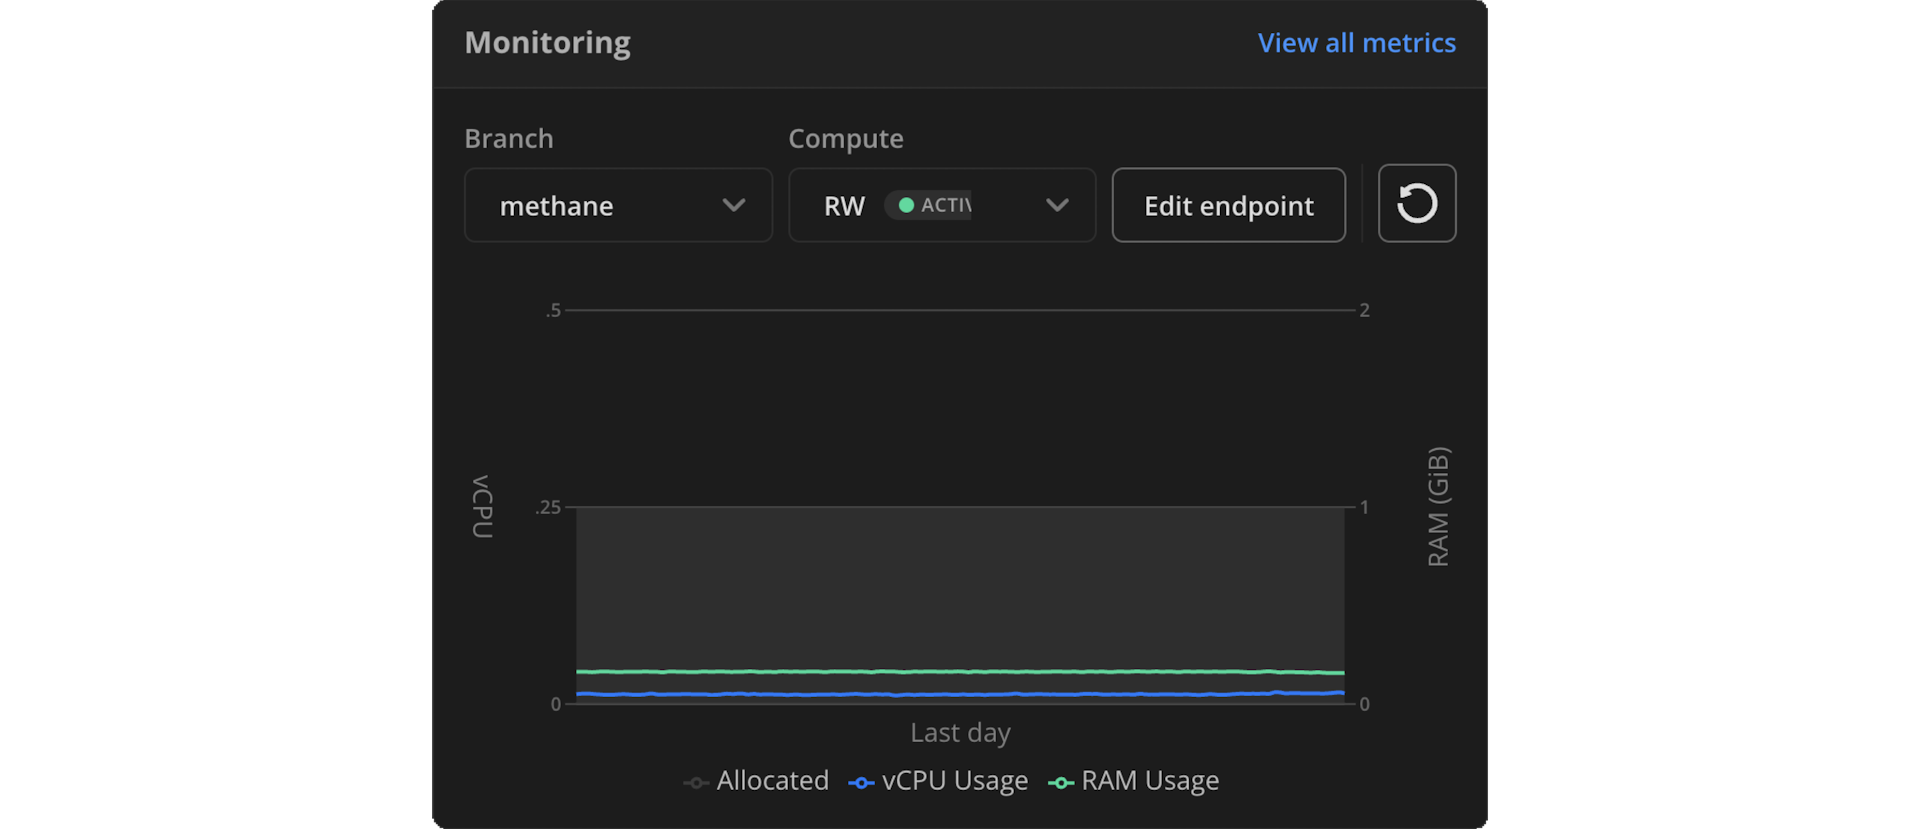
We're committed to improving observability for your Neon projects and databases. To learn more about monitoring in Neon, see Monitoring.
A teaser for organizations
You might notice a new addition to our breadcrumb navigation: Create organization under your account selector. It's greyed out and inactive for now, but we've included it here as a reminder: organization support is coming soon!
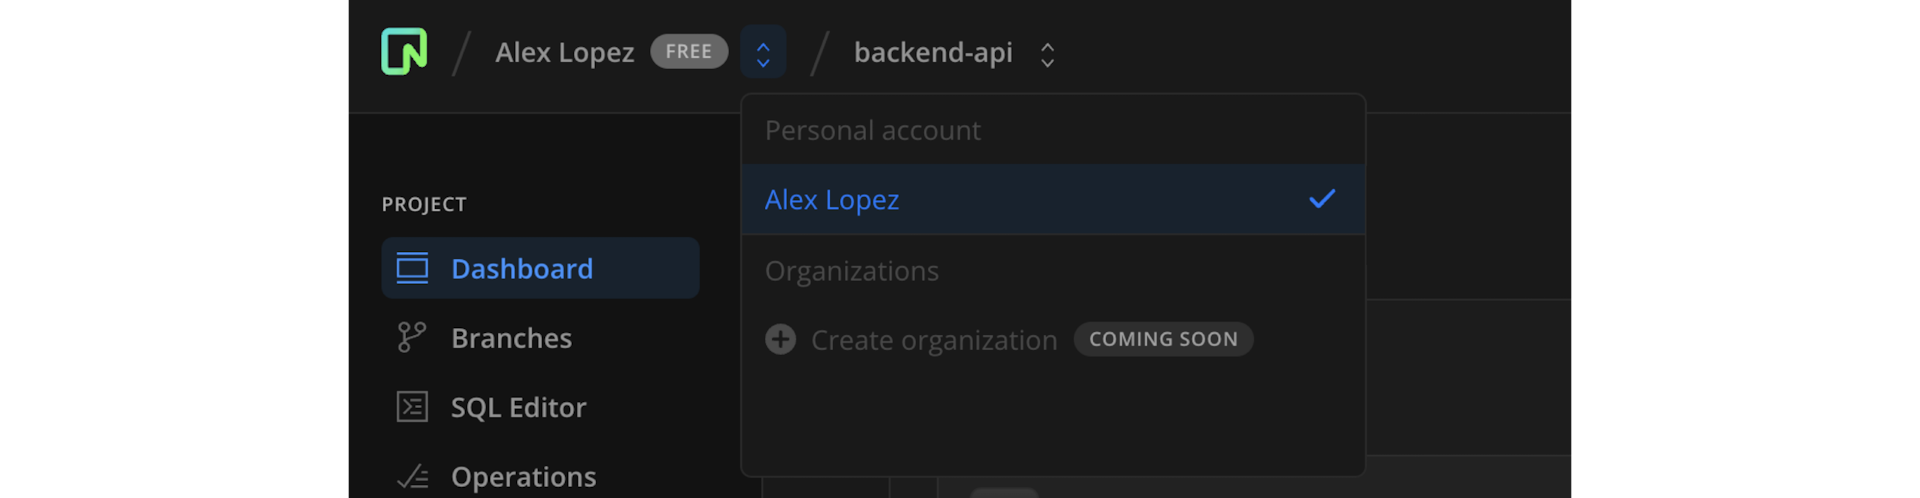
Check our roadmap to see what else is coming next.
PostgreSQL Partition Manager extension
Neon now supports the pg_partman partition manager extension, which enables creating and managing time and number-based table partition sets in Postgres.
Local File Cache (LFC) statistics and working set size function
You can now view Local File Cache (LFC) statistics for your Neon compute. The statistics include a cache hit ratio, which can help you determine if your data is being accessed from memory or the Neon storage layer.
The Local File Cache (LFC) stores frequently accessed data in the local memory of your Neon compute instance, which helps reduce latency and improve query performance by minimizing fetches from storage. The LFC acts as an add-on or extension of Postgres shared_buffers, which is set to 128 MB in Neon, regardless of compute size. The LFC extends cache memory to as much as 80% of your compute's RAM.
Local File Cache (LFC) statistics are exposed through a neon_stat_file_cache view, provided by the neon extension. To access the view, install the neon extension on a preferred database or connect to the Neon-managed postgres database where it's preinstalled. For instructions, see The neon extension.
You can retrieve LFC stats with the following query:
SELECT * FROM neon_stat_file_cache;
 file_cache_misses | file_cache_hits | file_cache_used | file_cache_writes | file_cache_hit_ratio
-------------------+-----------------+-----------------+-------------------+----------------------
           2133643 |       108999742 |             607 |          10767410 |                98.08
You can also use EXPLAIN ANALYZE with the FILECACHE option to view data for LFC hits and misses. See View LFC metrics with EXPLAIN ANALYZE.
To learn how LFC data can help you right-size your compute, see How to size your compute.
Fixes & improvements
- For the Neon serverless driver, the 15-second proxy timeout for SQL requests over HTTP has been removed.