
Have you ever stared at a complex database and thought, “What the F#!% did I get myself into?” If so, you’re not alone. Tables multiply, relationships tangle, and before you know it, you are lost in a monster of your own making, or worse, somebody else’s.
This is where something like an Entity-Relationship Diagram (ERD) comes into play. It’s not new—database designers have been using them for decades. But they’re more relevant than ever in our interconnected, data-driven world.
What is an ERD?
At its core, an ERD is a visual representation of your database. It shows:
- Entities (usually tables)
- Attributes (columns in those tables)
- Relationships between entities (foreign keys)
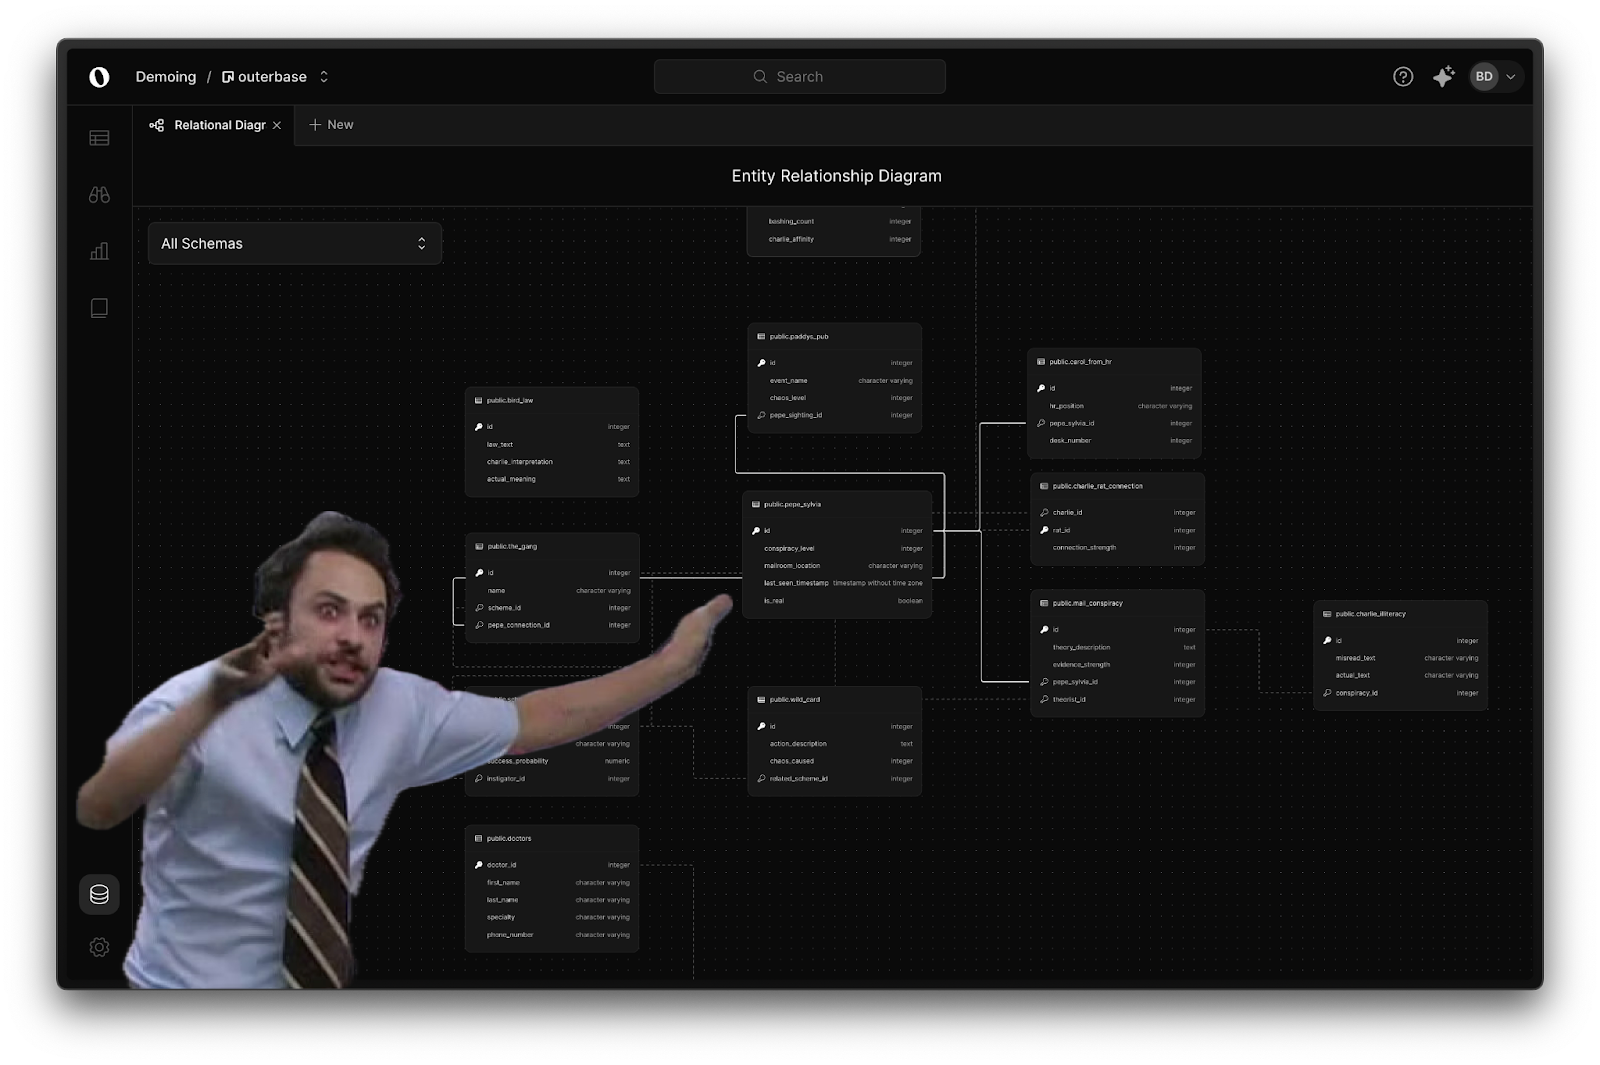
Imagine a simple blogging platform. You might have tables for Users, Posts, and Comments. An ERD would show these as boxes, with lines connecting them to illustrate relationships. At a glance, you can see that a User can have many Posts, and a Post can have many Comments. Or you might have a much more complex schema like in the example here.
How ERDs can help you build your Postgres relations
Understanding primary and foreign keys in Postgres is critical for data integrity and referential integrity. ERDs visually represent these key constraints, making it easier to manage and maintain your Postgres database.
Database design is as much art as science. While an ERD can show you if your schema is normalized, it can’t determine if your design makes sense for your specific use case. That still requires thought and domain knowledge. As applications grow more complex, with new features and more stakeholders involved, an ERD can serve as a crucial map in this increasingly intricate landscape.
Here are three concrete advantages of having ERDs at hand:
Turn abstract database structures into visual representations
By highlighting primary keys, which uniquely identify records, and foreign keys, which link tables, ERDs make it easier to comprehend the overall design and interactions within your Postgres database.
Make schema design accessible
Databases can be intimidating, especially for non-technical team members or beginners. ERDs provide a visual tool that simplifies database design, making it accessible for everyone, and ensuring that database structures are easily communicated and comprehended.
Understand the current state
ERDs make it much easier to visualize the existing models and relationships, essential when adding new features or scaling your application. Understanding how tables relate through primary and foreign keys makes it easier to design a robust, scalable schema.
Get ERDs automatically for your Neon databases via Outerbase
Manually creating and maintaining ERDs can be tedious and time-consuming, but that’s where Outerbase comes in. Outerbase recently added a feature to automatically generate ERDs for your Neon database, making it easier than ever to build ERDs for Postgres:
- No manual diagramming is required—your diagrams are built automatically.
- Your ERD updates automatically as your schema changes, always staying current.
If you’re already using Neon to manage your database, Outerbase is just one click away to visualize your table relationships.
How to view your Neon database ERD
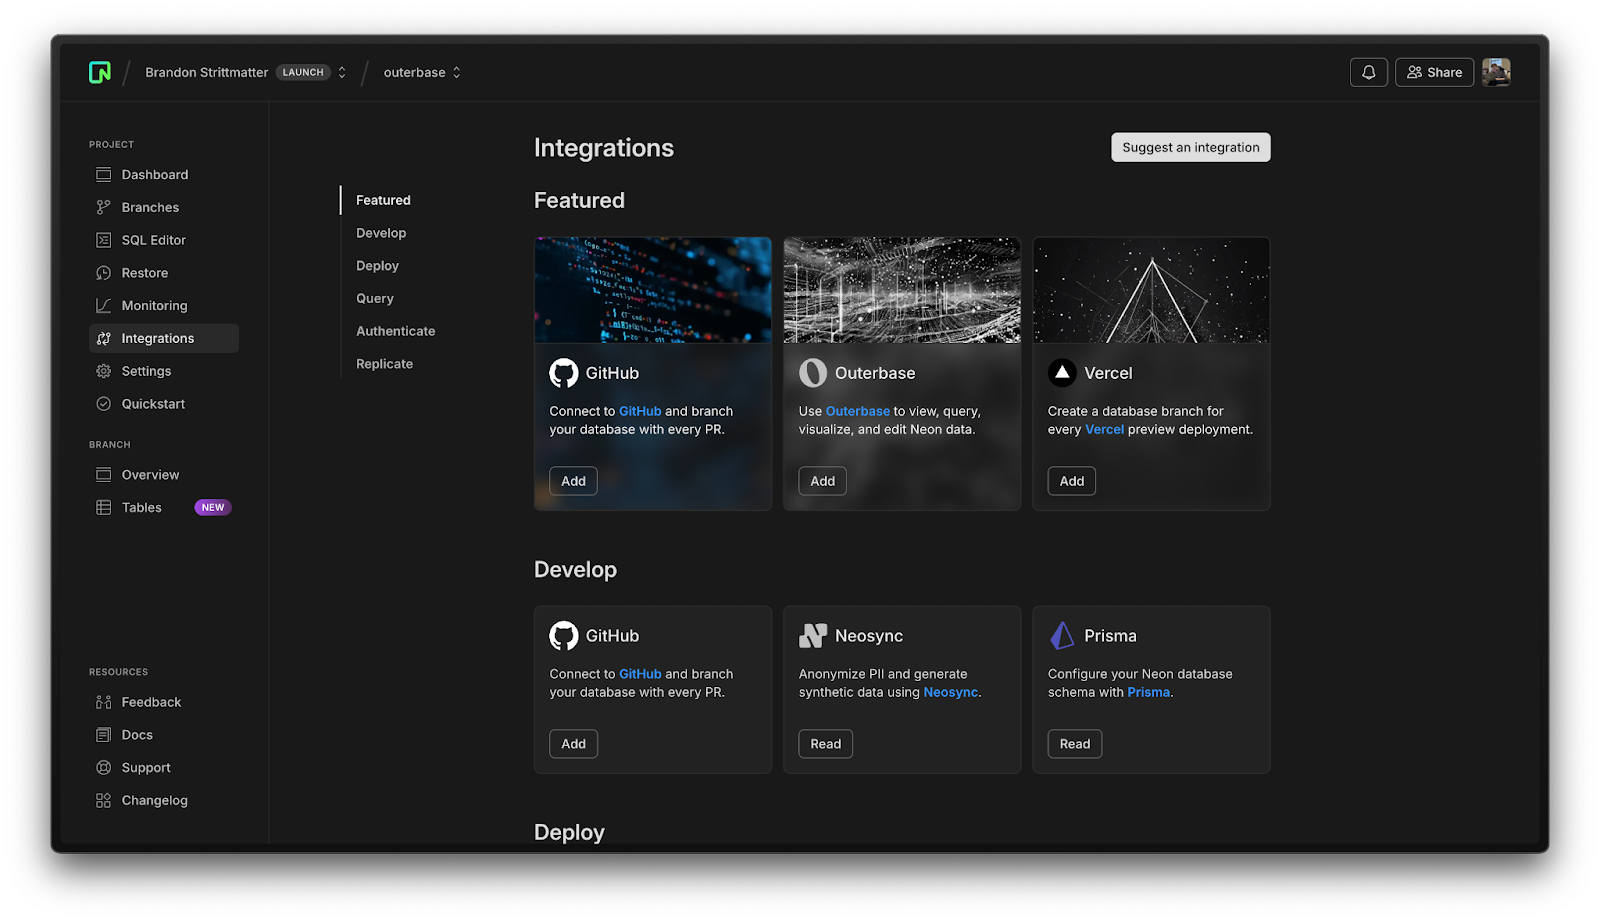
Go to Neon Console > Integrations. Add Outerbase.
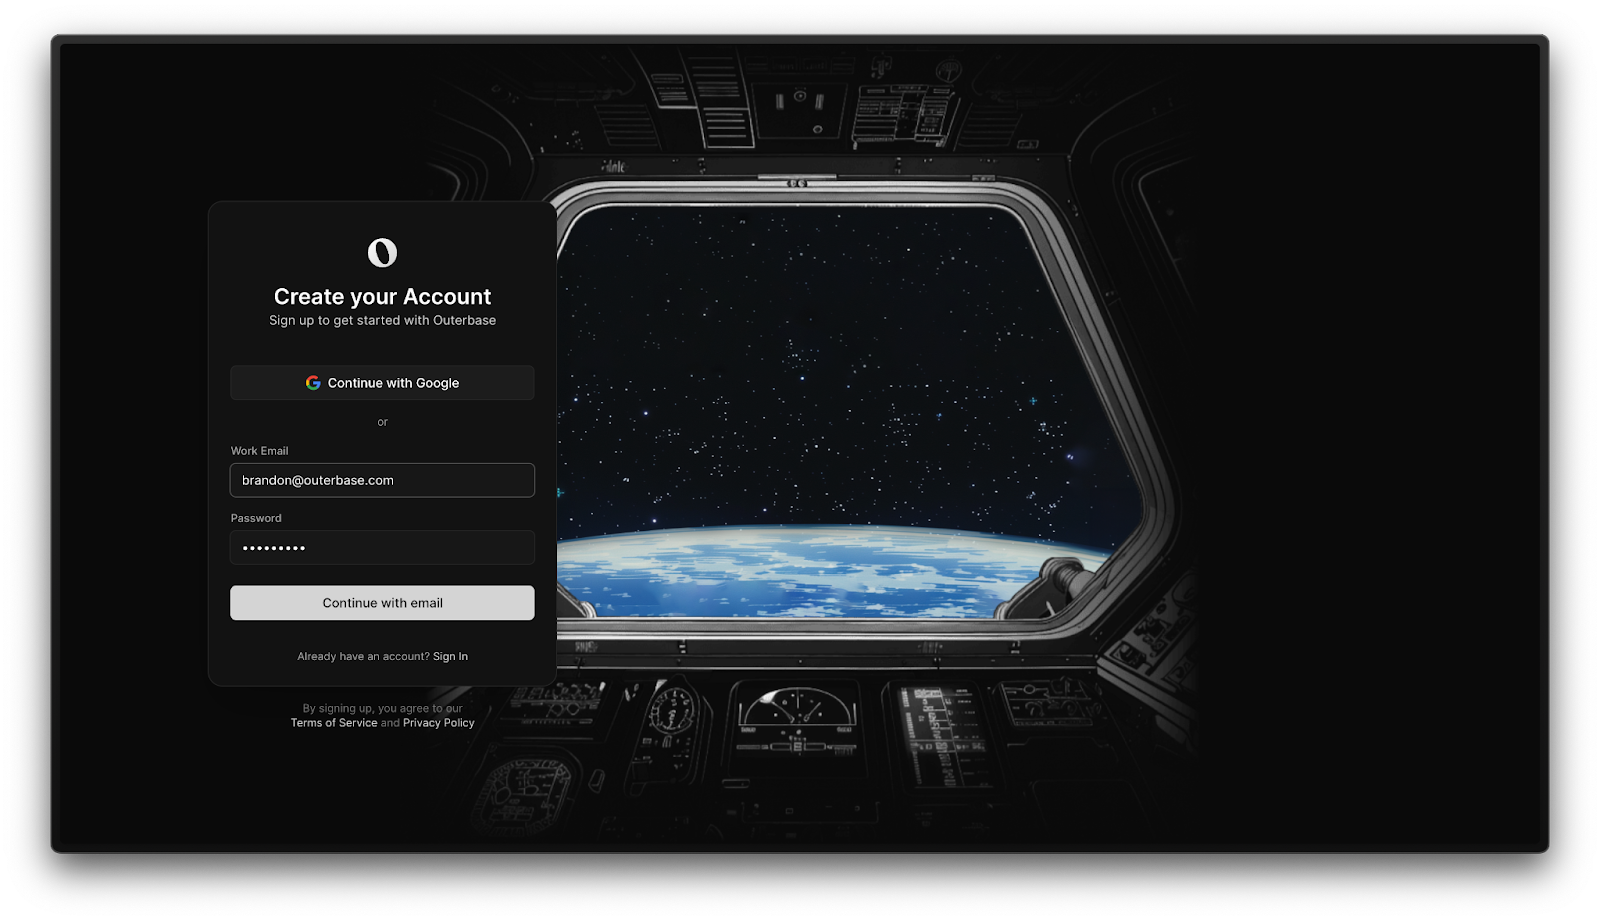
Sign up for an Outerbase workspace or log in if you already have an account and give it access to your Neon database.
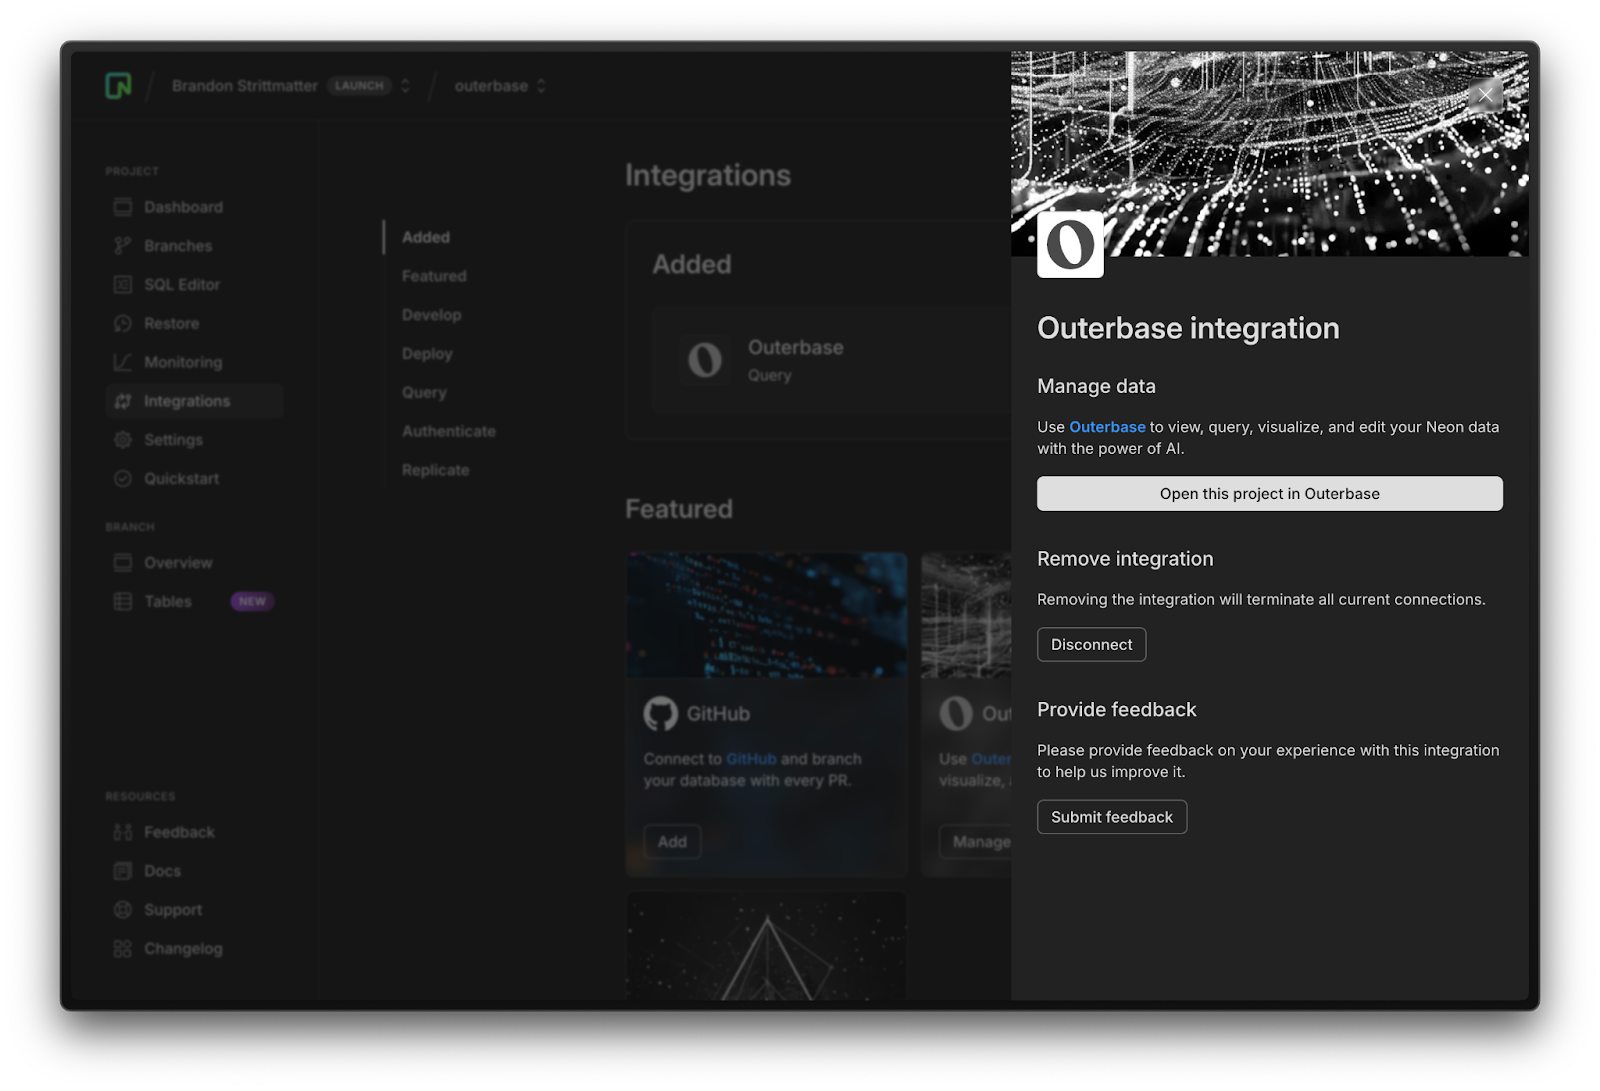
This will take you back to Neon, choose your database. Click “Open in Outerbase”.
Now find the database icon (bottom left) and then click on the “Relational Diagram”.
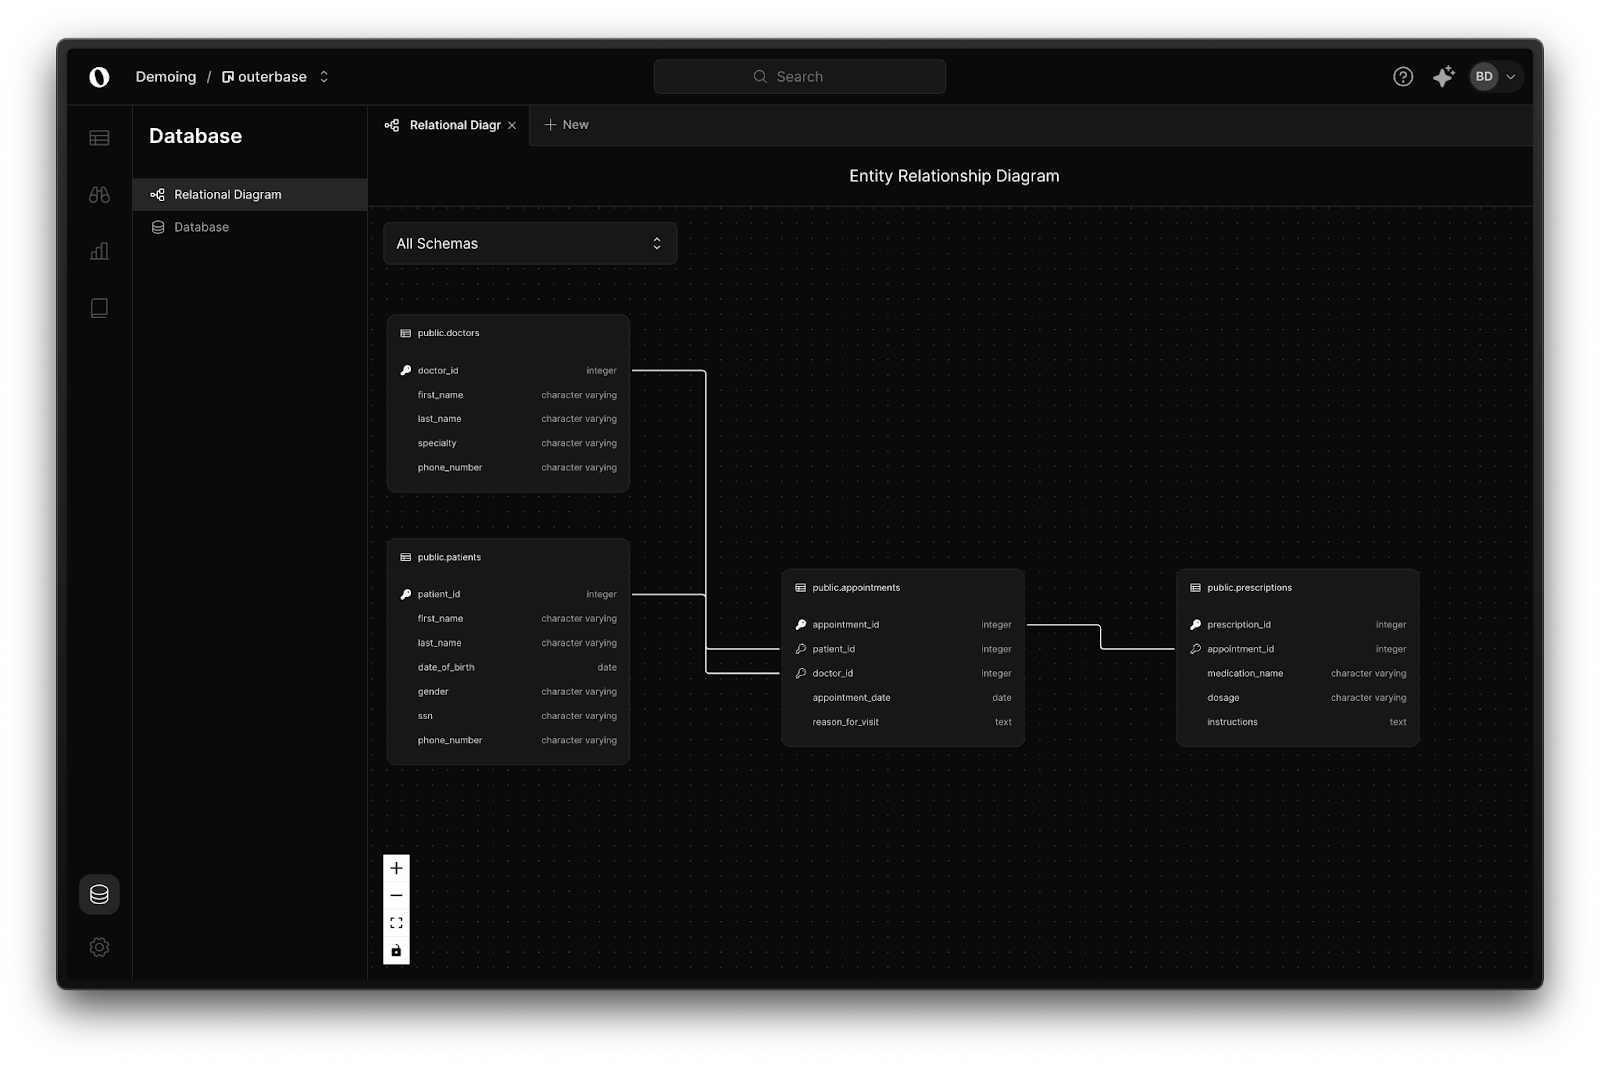
That’s it, it’s that easy, you now have your ERD. Click on a table to see all of it’s relationships, filter schemas to drill down, and watch it update as you make changes – it’s a powerful way to visualize your database structure.
Bonus: With your database now connected, you can do even more in Outerbase: build dashboards, collaborate with your team, and use AI to generate SQL queries. Each feature crafted to make your data management experience so much more powerful.
Looking forward
Tools like Neon and Outerbase’s automatic diagram generation are making databases more accessible. We are moving away from the days when DBAs were the gatekeepers; now, every developer wants and needs database access.
With Outerbase’s EZQL, auto-generating SQL is easier than ever. In the near future, you might even collaborate with AI to optimize your database schema, visualizing differences and improvements.
This democratization of data is powerful. It allows developers to better understand and control their data structures, facilitates communication between technical and non-technical team members, and makes systems more transparent and robust.
The next time you’re stuck on a database issue or explaining your data model to a colleague, generate a diagram with Outerbase. A picture is worth a thousand words, and with instant generation and automatic maintenance, there’s no reason not to visualize your database.


